Our Trend Value Score or “Value Score” for short is critical to all our features as it is the basis for how we rate and view picks (bets). It is an open calculation that allows us to grade all types of sports picks based on our trends measuring system. In its most simple form, the score is a historical profit index that helps us rank picks by their past profitability at 1-unit per pick.
Example
In this value score example, we see a Straight-up or Moneyline pick  . If you hover over the value score it will show you the actual number the score represents like this
  which in this case is +39% value for the Away team to Win outright (Moneyline).
Description
Prerequisite: the information below assumes that you have some knowledge of Picks and Trends and how they relate to one another.
Key

The basis of our value score is the “Net” or profit/margin which is the amount you would earn if you risked 1 unit on the pick. So, if look back historically at each pick’s trends you will find that certain trends are more profitable over time and those profitable trends you want to highlight on related picks to calculate the value score. So, once the trends are calculated at a maximum of 50 games in the past, we pick the row for that trend with the maximum Net which is what you see here…
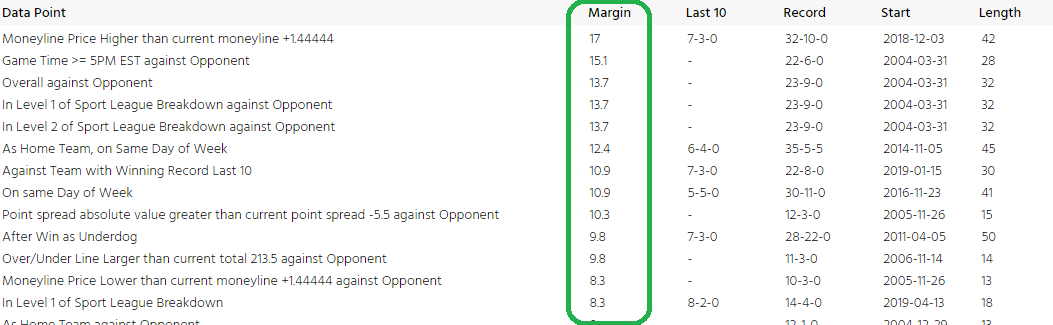
This maximum Net is then summed up across all the trends and divided by 1000 to make the score a small percentage value like 12% or 25% as examples. The formula is loosely categorized by the math below.
Calculation
SUM ( MAX ( NET ) [for each Trend] ) [for all Trends] ) / 1000
Calculation example
For a given trend, LA Laker +6, see the three example trends below:
Total Net = 57.2
Value Score = 57.2 / 1000 = +5.7%